The Pareto Principle (80/20 Rule): Doing Less, Achieving More
Most people don’t suffer from a lack of effort.
They suffer from effort spread too thin.
At work, it looks like this: long days, endless follow-ups, and the sense that you’re constantly busy – yet the impact feels limited. In personal life, it shows up as trying to fix everything at once and burning out before anything really improves.
The Pareto Principle offers a different way to think.
Not harder.
Not faster.
Just smarter focus.
What Is the Pareto Principle (80/20 Rule)?
The Pareto Principle suggests that a small number of causes often create a large portion of results.
In simple terms:
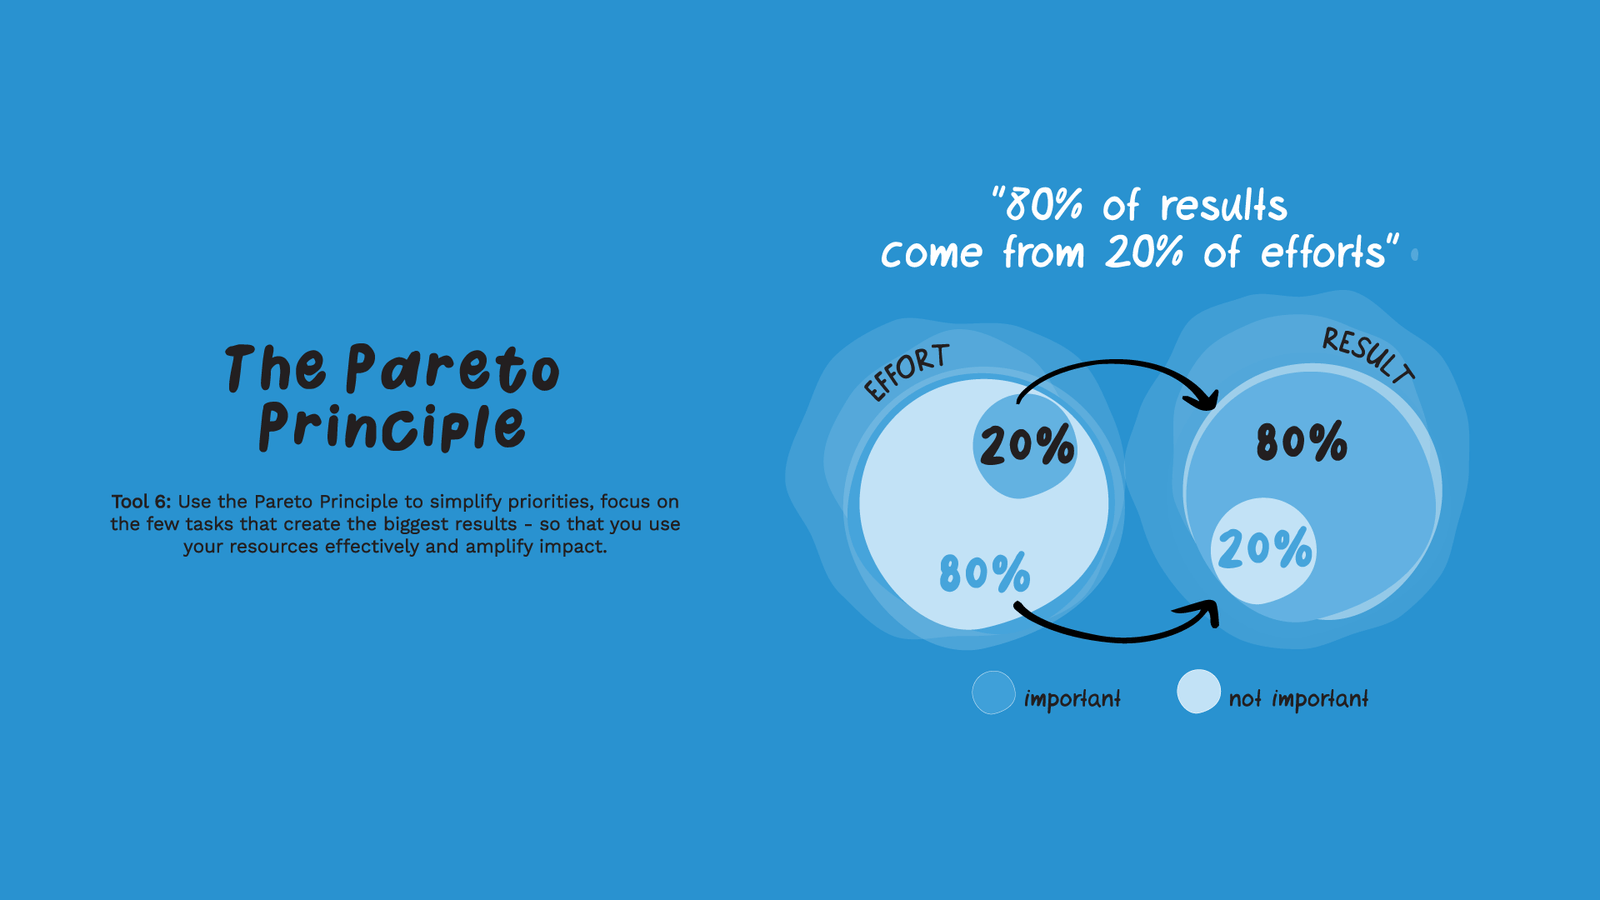
- Around 20% of efforts drive 80% of outcomes
- Around 20% of problems cause 80% of issues
- Around 20% of customers generate 80% of revenue
The exact numbers may vary, but the pattern appears everywhere — across industries, teams, systems, and even personal habits. The real question is not whether this imbalance exists.
It’s whether we choose to identify and act on it.
Where the Pareto Chart Comes In
A Pareto Chart is the visual companion to the Pareto Principle.
It looks like:
- A bar chart, with causes arranged from most frequent to least
- A cumulative percentage line, showing how quickly impact adds up
What it reveals very clearly is the “vital few” – the small number of factors creating most of the effect.
For example:
- A few types of errors causing most delays
- A handful of reasons behind most customer complaints
- A small number of processes generating most waste
When teams see this visually, decision-making becomes easier – and far less subjective.
Why This Tool Is So Powerful
The Pareto approach helps people stop treating everything as equally important – because it isn’t.
In the workplace
- Teams focus improvement efforts where it matters most
- Leaders can explain why certain priorities come first
- Resources are used intentionally, not reactively
In personal and professional growth
- You identify habits that give disproportionate returns
- You stop over-investing in low-impact activities
- You build momentum through visible wins
This is why the Pareto Principle shows up in quality improvement, leadership development, project management, and productivity systems worldwide.
When Should You Use the Pareto Lens?
Use it when:
- You’re facing recurring problems
- You need to decide where to focus improvement efforts
- You have data but don’t know where to start
- You feel overwhelmed by too many issues at once
It’s especially useful when reviewing: Incident types, Error causes, Cancellations or delays, Customer feedback categories, Waste or inefficiency patterns
How to Use It (Practically)
- Collect data
This may already exist – reports, logs, feedback, metrics. - Group data into categories
Causes, types, reasons – whatever makes sense for your context. - Count frequency per category
Pareto charts work best with a reasonable amount of data (generally 30+ observations). - Plot the chart
Bars from highest to lowest + cumulative percentage line.
Identify the vital few
Focus improvement efforts on the top contributors – not everything.
⚠️ Important note:
A Pareto chart shows where to focus, not the full root cause. It’s a starting point, not the final answer.
The Real Value of 80/20 Thinking
The Pareto Principle doesn’t encourage neglect. It encourages discernment.
It asks:
- What truly drives results here?
- What deserves attention now?
- What can wait or be simplified?
When you start applying this mindset, productivity feels lighter, not heavier. Progress accelerates when focus becomes intentional.
If your team or process needs clarity on where to invest effort for maximum impact, Pro-edge helps organizations identify, prioritize, and improve what truly matters. Visit Process Outsourcing services.
Leave A Comment